The bullish trend for stocks continues, but there is likely to be a test of wills in the next couple of weeks, as the Federal Reserve will deliver its next interest rate increase and the bears will likely try to reassert their will. Moreover, the market has now reached the point at which it must decide whether this is a new bull market or not, which means that some indecision will creep into trading strategies.
Bullish Summer Built on Liquidity and Bearish Sentiment Climate
The Summer Rally for 2022 has been a huge event, with the S&P 500 (SPX) and the Nasdaq 100 (NDX) indexes both delivering 20-plus percent gains off of their recent bottoms. Moreover, both indexes, as I detail below, are about to test important resistance levels. What that means is that the market could start to get a bit choppy as profit-takers start to exit and those who missed the rally consider getting into stocks on the hopes that there is another leg up.
The key to where prices go next, of course, will be based on how much liquidity is in the system and how traders assess what the Federal Reserve says and does at its September meeting. You can get a working overview of how this works in my latest Your Daily Five video.
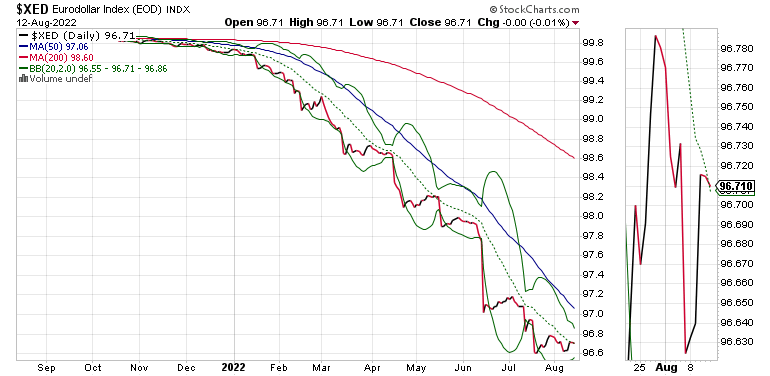
Note the stability in the Eurodollar Index (XED), an excellent measure of the market’s liquidity, over the last few weeks, and the beneficial effect which it has had on the equity markets. See below for a fully detailed analysis of XED and the rest of the market, along with what it may mean for the future.
Nevertheless, the take-home message is that, as long as there are enough doubters in the trading community and liquidity stays stable, stock prices can go higher unless the Federal Reserve decides to go nuclear and raise interest rates by 75 or 100 basis points in September.
If You Missed the Rally Catch Up with and ETF
Regular readers of this weekly update and subscribers of Joe Duarte in the Money Options.com have likely participated in this rally. But, if you didn’t follow our recent recommendations, you can still join the rally via an ETF, such as the ProShares Ultra QQQ (QLD).
QLD is a leveraged ETF which trades at 2x the underlying Nasdaq 100 index. Because of the leverage, it’s a good vehicle to catch up as long as you are aware of the fact that if the market turns lower, QLD’s value will drop faster than the underlying index.
I recommended QLD on 7/20/22 and, as of 8/12/22 near the end of trading, the ETF was up 19% from its entry point at $47.51. Of course, to trade this ETF, you need a sell stop, which I’ll be updating in my weekend portfolio update for subscribers.
As it stands, however, QLD has crossed a fairly significant resistance band at $55 and could move all the way back to $65, if the current market trend remains intact.
Both Accumulation/Distribution (ADI) and On Balance Volume (OBV) are moving higher, with ADI leading the way as the short sellers scamper. There is big resistance overhead at $65 or so where the 200-day moving average and a large Volume by Price Bar (VBP) converge.
I own shares in QLD as of this writing.
Bonds and Oil are Playing Peekaboo
Two important markets, U.S. Treasury Bonds and Crude Oil futures are trying to figure out where they go next. Of course, their interaction is important because lower oil prices have lowered inflationary expectations of late. And lower inflationary expectations are good for bonds.
For its part the U.S. Ten Year Note yield (TNX) are rangebound between 2.5% and 3%, and any kind of move above or below this range will likely impact not just oil prices, but also stocks and currencies. All of which means that the next inflation reports (CPI and PPI) will likely be market-moving events.
On the other hand, West Texas Intermediate Crude Oil (WTIC) is looking to find support at its 200-day moving average. It is still being plagued by the notion that demand is falling due to decaying economic activity in Europe and the emerging markets.
Meanwhile Brent Crude (BRENT), the European benchmark crude oil contract, has already moved back above its 200-day moving average, as natural gas shortages in Europe due to the Ukraine war and Russia’s Nord Stream pipeline flow reduction to Europe are starting to get serious. Adding uncertainty to the whole situation is the worsening drought of major rivers in Germany and France, which are reducing barge transport and threaten to hamper the ability to transport fuels, including coal and petroleum, along with other cargoes throughout Europe.
Welcome to the Edge of Chaos:
“The edge of chaos is a transition space between order and disorder that is hypothesized to exist within a wide variety of systems. This transition zone is a region of bounded instability that engenders a constant dynamic interplay between order and disorder.” – Complexity Labs
Market Breadth Remains Bullish, Liquidity Remains Stable
Stocks powered higher last week, with bullish market breadth benefiting by adequate liquidity. The NYAD Advance-Decline line (NYAD) crossed above its 200-day moving average, returning to bull market territory, at least for now. For its part, the CBOE Volatility Index (VIX) closed below 20, a new low for this move, a sign that bearish sentiment is now evaporating as hedge funds pile on to the long side of stocks after missing the rally thus far.
Meanwhile, the Eurodollar Index (XED), which measures liquidity, remained stable, which is a positive. If XED breaks down, however, I expect stock prices will follow.
The S&P 500 (SPX) remained above the 4000-4100 support band, with 4200-4300 and the 200-day moving average being the next big resistance level. Accumulation Distribution (ADI) remains encouraging, which means short-covering is ongoing. Unfortunately, we have yet to see a turn up in On Balance Volume (OBV), which remains a sign that buyers are still a bit skittish.
Similarly, the Nasdaq 100 index (NDX) is also showing some encouraging signs, as it now delivered a bullish close above 13,000. That could take NDX to 14000, where a consolidation or even a reversal are possible. Accumulation Distribution (ADI) is suggesting short sellers are still stampeding out and On Balance Volume (OBV) is also rising.
Which is the best-looking energy stock at the moment? Find out with a FREE trial to my service (click here) and learn more about my risk-averse approach to trading stocks.
To get the latest up-to-date information on options trading, check out Options Trading for Dummies, now in its 4th Edition – Get Your Copy Now! Now also available in Audible audiobook format!
#1 New Release on Options Trading
Good news! I’ve made my NYAD-Complexity – Chaos chart (featured on my YD5 videos) and a few other favorites public. You can find them here.
Joe Duarte
In The Money Options
Joe Duarte is a former money manager, an active trader and a widely recognized independent stock market analyst since 1987. He is author of eight investment books, including the best selling Trading Options for Dummies, rated a TOP Options Book for 2018 by Benzinga.com and now in its third edition, plus The Everything Investing in Your 20s and 30s Book and six other trading books.
The Everything Investing in Your 20s and 30s Book is available at Amazon and Barnes and Noble. It has also been recommended as a Washington Post Color of Money Book of the Month.
To receive Joe’s exclusive stock, option and ETF recommendations, in your mailbox every week visit https://joeduarteinthemoneyoptions.com/secure/order_email.asp.


