


In the previous technical note, we mentioned how the Indian equities stayed in a defined range, as they traded within the defined corners while respecting basic technical levels. In the week that has gone by, the NIFTY once again made measured moves, continuing to strongly inherit buoyancy from the US markets that tried to stabilize themselves and put a potential temporary bottom in place. The previous week was a four-day week, with one trading holiday on account of Dussehra; the NIFTY moved in a 573.25 range before ending the week on a positive note. The headline index NIFTY50 closed the week with a net weekly gain of 220.30 points (+1.29%).
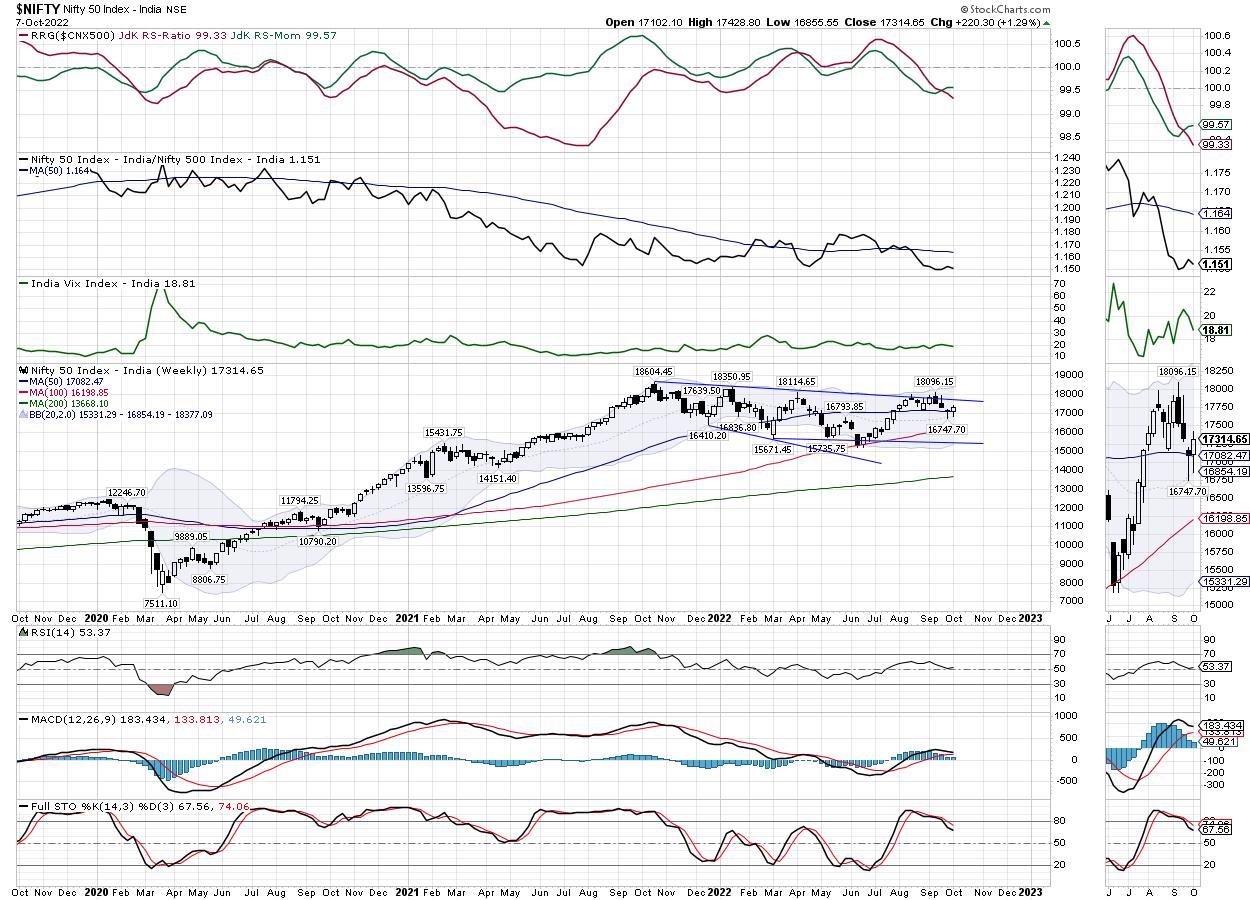
The week before last saw the NIFTY bouncing off from the 20-Week MA, which stands at 16854. It had halted its move near the 50-Week MA; this week, it moved above that level as well. The 50-Week MA has positioned itself at 17084. From a technical perspective, the present structure of the weekly charts makes the zone of 16850-17100 a strong support zone for the markets. So long as this zone stays defended, all that the markets would ever see would be simply corrective turbulence, with no major breakdown on the charts. But if the 16850 level is violated, we will need to take that technical development rather seriously.
The coming week is expected to see the levels of 17490 and 17635 acting as potential resistance levels. The supports are expected to come in at the 17100 and 16850 levels.
The weekly RSI is 53.37; it remains neutral and does not show any divergence against the price. The weekly MACD is bullish and trading above the signal line. However, the narrowing slope of the Histogram shows that the momentum on the way up is decelerating; it would be interesting to see if this gets corrected. No significant formations were seen on the Candles.
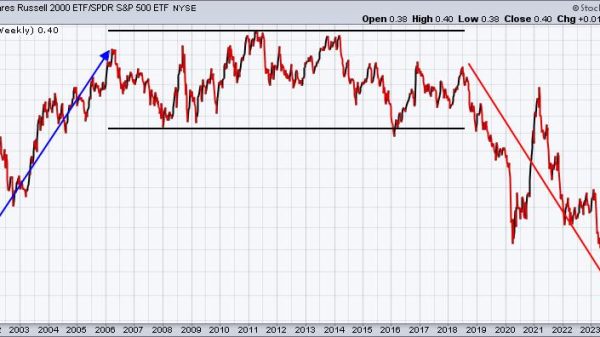
The pattern analysis of the weekly chart shows that the NIFTY still rules below the important falling trend line pattern support, while continuing to trade above all the key moving averages. This falling trend line begins from the lifetime high point of 18600 and joins the subsequent lower tops. A move above 17800 would translate into a breakout above this falling trend line pattern resistance.
Although Indian equities remain resolute and relatively very strong against the global markets., the weakness in the global markets still affects the domestic market. However, with the US markets trying hard to form a potential base for themselves, any stability or a rebound in those markets will have very stronger repercussions on the domestic market, given the strong relative strength. The present texture of the markets has grown both stock-specific and defensive. We will see some defensive pockets doing well, as well as some select names from Auto, PSE and Media posting a good show over the coming days. A cautiously positive approach is advised for the coming week.
Sector Analysis for the Coming Week
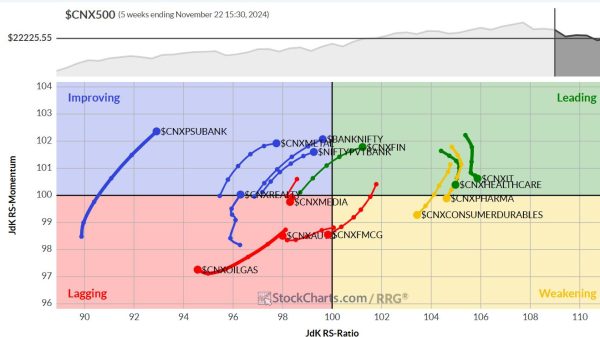
In our look at Relative Rotation Graphs®, we compared various sectors against CNX500 (NIFTY 500 Index), which represents over 95% of the free float market cap of all the stocks listed.
The analysis of Relative Rotation Graphs (RRG) shows that NIFTY Midcap, Financial Services and NIFTY Bank are inside the leading quadrant. They will continue to relatively outperform the broader markets; they are also seen taking a breather in terms of their relative momentum. Better placed within the leading quadrant is the NIFTY PSU Bank Index; this group will also see itself relatively outperforming the broader NIFTY 500 Index.
The NIFTY Consumption, FMCG and Auto Indexes continue to advance further within the weakening quadrant.
All the incumbents of the lagging quadrant — Energy, Infrastructure, IT, PSE, and Pharma Sectors — are seen sharply improving on their relative momentum against the broader markets. These pockets may see stock-specific performance over the coming days.
NIFTY Media has rolled inside the improving quadrant; this is a sign that the relative underperformance of this group might end and we may see it improving its relative performance against the broader markets. The NIFTY Metal Index is also placed firmly within the improving quadrant.
Important Note: RRG™ charts show the relative strength and momentum for a group of stocks. In the above chart, they show relative performance against NIFTY500 Index (Broader Markets) and should not be used directly as buy or sell signals.
Milan Vaishnav, CMT, MSTA
Consulting Technical Analyst
www.EquityResearch.asia | www.ChartWizard.ae