


After a volatile Thursday and Friday, Monday continued, but, like Thursday, it was again to the upside. As we try to hammer in a bottom here, a few charts stand out.
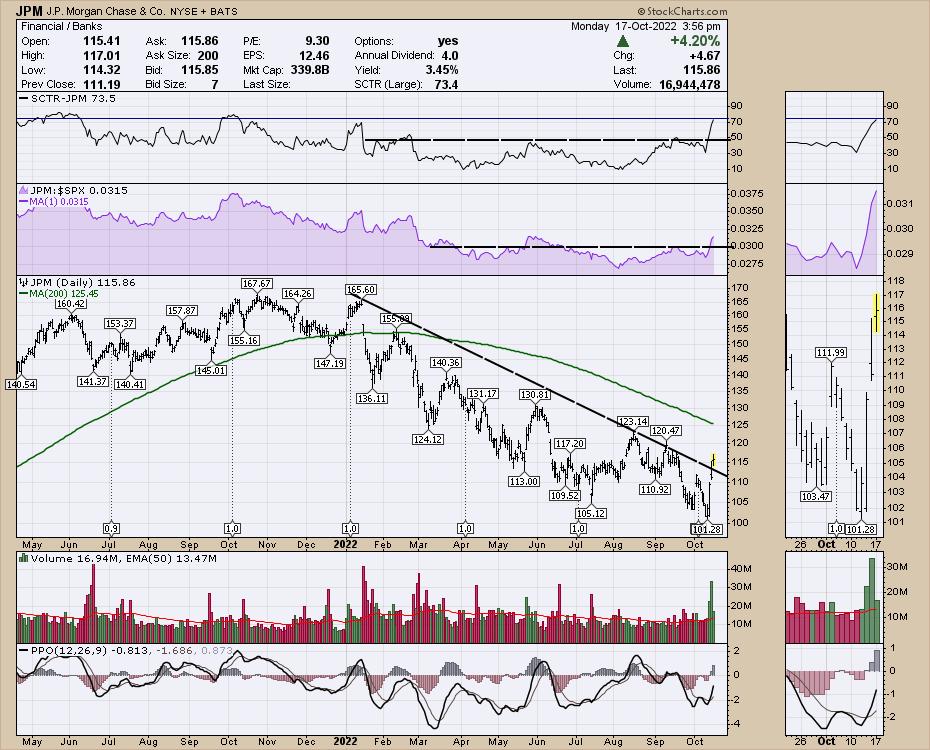
First of all, the banks are starting to behave bullishly. JPM popped nicely on earnings and broke the trend line, then continued to push higher Monday. Notice the surge on the SCTR, with the highest level in a year! I like the Relative strength (RS) compared to the $SPX hitting new 4-month highs.
Bank of America (BAC) also changed the down trend by breaking and closing above the trend line. Just like the JPM chart, the SCTR ranking is surging and the RS line is improving meaningfully.
Citi (C) has not moved as far, but perhaps it will join the bank party. What I like about the indicators I have chosen is how they are showing changes compared to the $SPX and the large cap peer group. It is this external validation on the charts above that suggests something is changing for those two banks that has not started with our friends at Citi.
Below are a couple charts that are threatening the other side of the trend. The first is the US Dollar, shown here with the UUP. The SCTR ranking is still holding up well, whereas the RS in purple looks like it might break the 6-week uptrend. The US Dollar started accelerating higher around mid-August, which was also when the equity markets topped out. Should be an important week to see what the dollar wants to do.
Natural Gas (UNG), the product everyone needs going into the winter, is breaking the uptrend? The logic doesn’t make sense, but using the chart for informational clues tells us what investors are doing with their money. If you are a Natural Gas bull, it’s an odd look. Price had already dropped 30% from the highs, but that is a significant trend change, as it broke the 2022 uptrend for the first time.
Seeing the rotation from what has been working to new charts starting to work is new to 2022. I think this marks a significant change in what has been working. These charts lean in to the idea that the market might be changing direction on a bigger trend. Stay tuned!
For more informative ideas head over to OspreyStrategic.org.