When concerns of a recession are front and center, investors tend to pay more attention to the Gross Domestic Product (GDP) report. The Q4 2022 GDP report showed the U.S. economy grew by 2.9% in the quarter, and Wall Street wasn’t disappointed. The day the report was released, the market closed higher, with the Dow Jones Industrial Average ($DJIA) up 0.61%, the S&P 500 index ($SPX) up 1.1%, and the Nasdaq Composite ($COMPQ) up 1.76%. Consumer Discretionary, Technology, and Energy were the top-performing S&P sectors.
Add to the GDP report strong earnings from Tesla, Inc. (TSLA) and a mega announcement from Chevron Corp. (CVX)—raising dividends and a $75 billion buyback round—and you get a strong day in the stock markets.
Why is the GDP Report Important?
If a country’s GDP is growing faster than expected, it could be a positive indication of economic strength. It means that consumer spending, business investment, and exports, among other factors, are going strong. But the GDP is just one indicator, and one indicator doesn’t necessarily tell the whole story. It’s a good idea to look at other indicators, such as the unemployment rate, inflation, and consumer sentiment, before making a conclusion.
Inflation appears to be cooling, but the labor market continues to be strong. The Fed has stated in many of its previous meetings that it’ll be closely watching the labor market. So that’ll be a sticky point as we get close to the next Fed meeting. Consumer spending is also strong, according to the GDP report. But that could have been because of increased auto sales and spending on services such as health care, personal care, and utilities. Retail sales released earlier in January indicated that holiday sales were lower.
There’s a chance we could see retail sales slowing in Q1 2023 as some households run out of savings that were accumulated during the pandemic. This is something to keep an eye on going forward, as a slowdown in retail sales could mean increases in inventories. And this is something that could decrease economic activity.
Overall, the recent GDP report indicates the U.S. economy is strong, although some economists feel we’ll probably see some downside in 2023, though not a recession. But the one drawback of the GDP report is that it’s lagging. It comes out after the fact. Wouldn’t it be great if you had known this ahead of time so you could position your trades to take advantage of the rally? While there’s no way to know with 100% accuracy, there are ways to identify probable events.
3 Ways To Stay Ahead of the Curve
Instead of waiting for three months to get next quarter’s GDP report, you can gauge the potential strength or weakness of the overall U.S. economy. Steven Sears, in his book The Indomitable Investor, suggested looking at these charts:
Copper pricesHigh-yield corporate bondsSmall-cap stocks
Copper: An Economic Indicator
You may not hear much about copper, but it’s used in the manufacture of several goods and in construction. Given that manufacturing and construction make up a big chunk of economic activity, the red metal is more important than you may have thought. If you look at the chart of copper futures ($COPPER) you’ll see that, in October 2022, the price of copper was trading sideways, but, in November, its price rose and trended quite a bit higher. This would have been an indication of a strengthening economy.
CHART 1: COPPER CONTINUOUS FUTURES CONTRACTS. Copper prices have been rising since November 2022. Chart source: StockCharts.com. For illustrative purposes only.
High-Yield Bonds: Risk On Indicator
The higher the risk, the higher the yield. That’s the premise behind high-yield bonds. In short, companies that are leveraged, smaller, or just starting to grow may not have the solid balance sheets that more established companies are likely to have. If the economy slows down, investors are likely to sell the high-yield bonds and pick up the safer U.S. Treasury bonds.
Why the flight to safety? It’s because when the economy is sluggish, the companies that issue the high-yield bonds tend to find it difficult to service their debts. When the economy is expanding, the opposite happens—they tend to perform better.
The chart below of the Dow Jones Corporate Bond Index ($DJCB) shows that, since the end of October 2022, the index trended higher. Similar to copper prices, high-yield corporate bond activity was also indicating economic expansion. You’ll see similar action in charts of high-yield bond exchange-traded funds (ETFs) such as iShares iBoxx $ High Yield Corporate Bond ETF (HYG) and SPDR Barclays High Yield Bond ETF (JNK).
CHART 2: HIGH-YIELD BONDS TRENDING HIGHER. The Dow Jones Corporate Bond Index ($DJCB) has been trending higher since end of October 2022.Chart source: StockCharts.com. For illustrative purposes only.
Small-Cap Stocks: They’re Sensitive
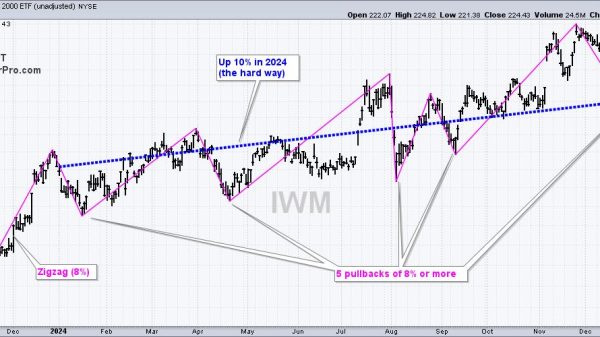
Pull up a chart of the iShares Russell 2000 ETF (IWM) and you’ll see similar price action (see chart 3). Since mid-October, small-cap stocks (the Russell 2000 index is made up of 2000 small companies) have been moving higher.
CHART 3: SMALL-CAP STOCKS TRENDING HIGHER. When the economy is expanding, small-cap stocks trend higher.Chart source: StockCharts.com. For illustrative purposes only.
Three’s Company
If all three of these indicators are showing strength, you can expect the GDP number to be strong. There are times when the GDP number may not impact the markets, but, when inflation is a problem and the Fed is trying to curb it by raising interest rates, the GDP number tends to impact the markets.
This scenario is likely to play out in 2023, so it would be worth your while to set up a GDP Tracker ChartList. Want a live link to the charts used in this article? They’re all right here.
Jayanthi Gopalakrishnan
Director, Site Content
StockCharts.com
Disclaimer: This blog is for educational purposes only and should not be construed as financial advice. The ideas and strategies should never be used without first assessing your own personal and financial situation, or without consulting a financial professional.


