


After posting decent gains in the week before this one, NIFTY chose to consolidate this time just below the key breakout levels. The five sessions were largely consolidatory in nature; the markets stayed devoid of any direction throughout this time and consolidated just below key resistance and breakout levels. However, given the consolidation in the markets, the trading range remained quite narrow; the index oscillated in a 197.90 points range throughout the week. While heading nowhere and steadfastly consolidating at key levels, the headline index closed flat with a negligible gain of 34.75 points (+0.19%) every week.
The markets now sit on a cusp of a breakout. The global trade setup is buoyant; we are set to get an extremely robust handover on Monday. The markets are set to open on a stronger note and attempt a breakout; however, for any such breakout to happen and sustain, NIFTY will have to move past and keep its head above 18600 levels. The Options data shows 18500 as strong support; it is also seen shifting its resistance levels higher. The key thing to look for in the coming week would be the ability of the markets to move past 18600 and sustain above that. The only thing that we need to continue to stay mindful of is the not-so-strong market breadth and the IndiaVix which stays at lower levels very near to the lows seen in 2020. Besides these two factors, the overall structure of the markets remains buoyant.
Monday is likely to give a strong start to the week. The levels of 18650 and 18785 are likely to act as resistance points. The supports come in at 18480 and 18300 levels.
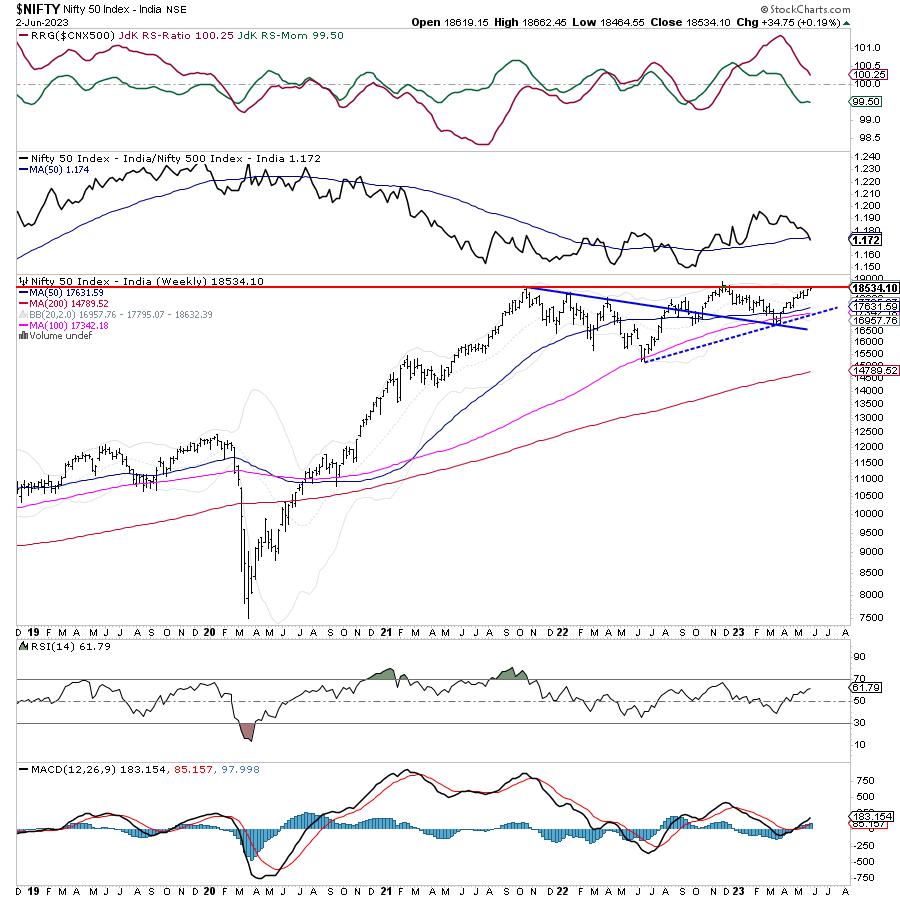
The weekly RSI is 61.79; it has formed a new 14-period high which is bullish. It stays neutral and does not show any divergence against the price. The weekly MACD is bullish and stays above the signal line.
The pattern analysis shows that the markets are sitting on a cusp of a breakout. It had the top of 18604 to move past if it has to make a breakout. Previously, the markets had tried to take these levels out; however, the breakout had failed as the NIFTY just formed an incremental high of 18887 and then drifted lower and slipped below the breakout point of 18604 and eventually failed the breakout.
Overall, the markets are poised at a crucial point; any move and sustenance above 18600 levels can lead to a breakout. However, more odds remain stacked in favor of a breakout, the market participants will have to stay very mindful of the not-so-strong market breadth and the low levels of the VIX. Collectively, they have the potential to make the breakout weaker and challenge its sustainability. It is strongly recommended to continue following the uptrend but stay extremely vigilant of any profit-taking bouts from higher levels. A positive outlook is advised for the day.
Sector Analysis for the coming week
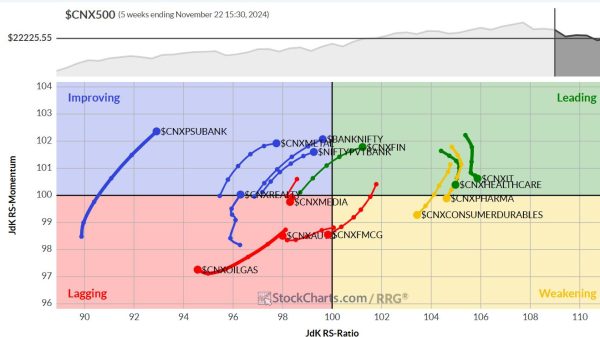
In our look at Relative Rotation Graphs®, we compared various sectors against CNX500 (NIFTY 500 Index), which represents over 95% of the free float market cap of all the stocks listed.
The analysis of Relative Rotation Graphs (RRG) shows Nifty Consumption, Auto, Midcap100, Realty, Pharma, and Banknifty are inside the leading quadrant of the RRG. These groups are likely to relatively outperform the broader NIFTY500 index.
The NIFTY PSE and Infrastructure are inside the weakening quadrant; the FMCG index has rolled inside the weakening quadrant. Individual performance from these groups may be seen but the relative performance may start taking a breather.
The NIFTY IT, Commodities, Metal, PSU Bank, and Media are inside the lagging quadrant. Except for the Commodities index, the other groups are showing improvement in their relative performance against the broader markets.
The NIFTY Energy index is placed inside the improving quadrant with some paring of relative momentum visible on it.
Important Note: RRG™ charts show the relative strength and momentum of a group of stocks. In the above Chart, they show relative performance against NIFTY500 Index (Broader Markets) and should not be used directly as buy or sell signals.
Milan Vaishnav, CMT, MSTA
Consulting Technical Analyst
www.EquityResearch.asia | www.ChartWizard.ae