


Scott Lincicome and Alfredo Carrillo Obregon
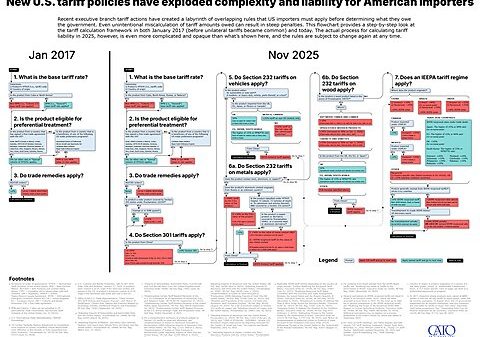
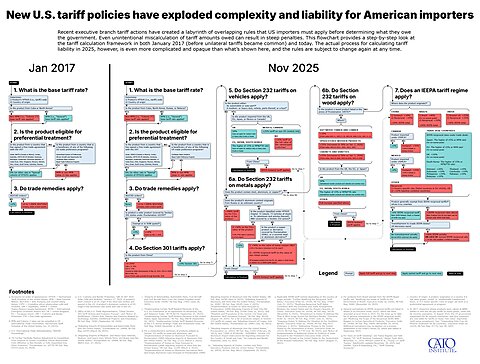
Back in December, we created a flowchart to map out the US tariff regime, which has become increasingly complex and convoluted due to President Trump’s tariff actions under Sections 232, 301, and the International Emergency Economic Powers Act (IEEPA). The first version of this flowchart is available here, along with our analysis on the complexity of the US tariff system, which we recently updated here.
Over the past few weeks, we’ve received some much-appreciated feedback on this chart, and US Customs and Border Protection released additional guidance clarifying which tariffs “stack” on top of each other. We have incorporated these comments and information and updated our tariff complexity flowchart accordingly.
Download full-size image ↓
We hope this chart proves helpful in untangling the complexity of the US tariff code—or at least in gaining a better understanding of it. Of course, this chart is likely to change soon, possibly even within the hour, if the Supreme Court invalidates the administration’s IEEPA tariffs. We’ll continue to update this chart as the US tariff system changes.